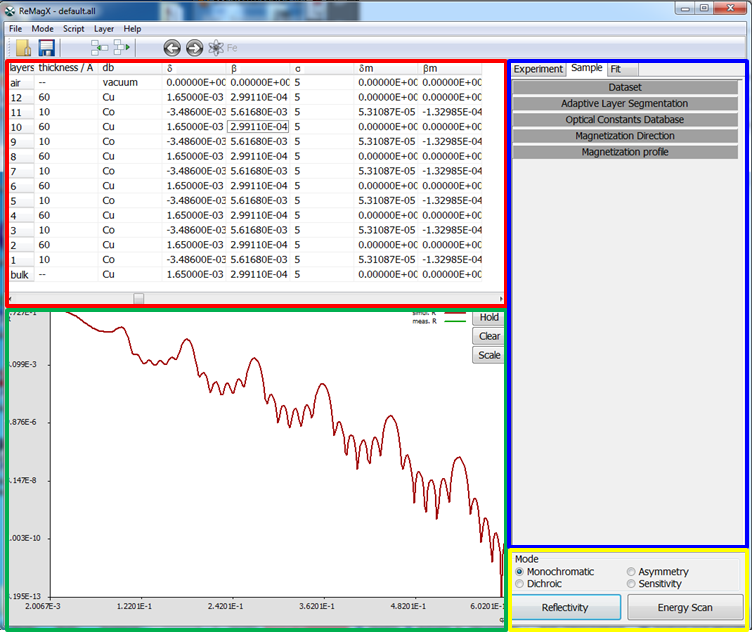
red: Layer Input Table - contains all parameters for the individual layers
green: Plot Window - graph window for plotting curves
blue: Settings Tabs - control of the simulation, experiment, fit, etc. parameters
yellow: start simulation
red: Layer Input Table - contains all parameters for the individual layers
green: Plot Window - graph window for plotting curves
blue: Settings Tabs - control of the simulation, experiment, fit, etc. parameters
yellow: start simulation